
Authors:
(1) Hans van Haren, NIOZ Royal Netherlands Institute for Sea Research, P.O. Box 59, 1790 AB Den Burg, the Netherlands.
Table of Links
3 Observations
3.1 Background data
Nevertheless, the time-series between days 110 and 265 during spring and summer 2005 showed some 10-day periods of relatively constant temperature and current speeds, e.g. between days 140-150. During such periods, |w| >> |e| near the ADCP (Fig. 2d), not only in low-frequency variations that are negatively biased due to the passage of meso-scale eddies (van Haren et al. 2006), but also in relatively higher frequency variations that reflect near-inertial motions, not instrumental noise, as will be demonstrated in the next sub-section.
3.2 Spectra
The two periods, before and after day 265, show distinctly different kinetic energy spectra (Fig. 3; spectra were computed over days 125-260 and 270-405 to have periods of similar lengths). During the first period compared to the second, energy levels are higher at nearly all frequencies and depths except for near-inertial motions below z < -2350 m (Fig. 3a,b; green and purple spectra). Near-inertial peaks at all depths (except -2720 m, purple spectrum) are much more similar during the first period (Fig. 3a) than during the second one (Fig. 3b). This indicates some relatively simple downward continuous propagation during the first period as compared to a less simple propagation during the second one.
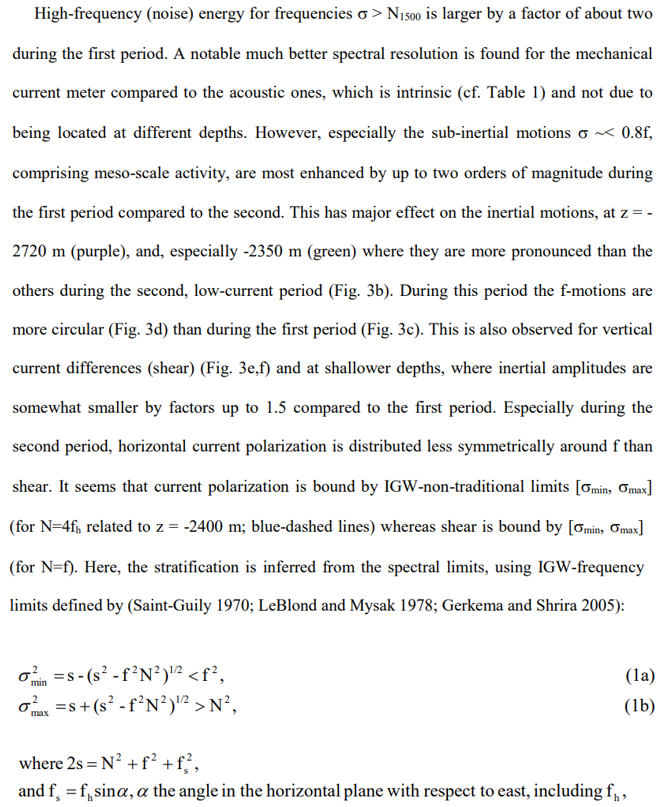
which contributes in meridional direction.
Second, polarization increases, becoming more circular, with depth, from blue (z = -1785 m) to green (-2350 m) in both periods (Fig. 3c,d). With increasing polarization, the nearinertial peak-frequency varies from super- to sub-inertial. Both observations confirm the trapping of sub-inertial motions in (deep) stratified layers and super-inertial motions in (intermediate) homogeneous layers.
3.3 Band-pass filtered time-series
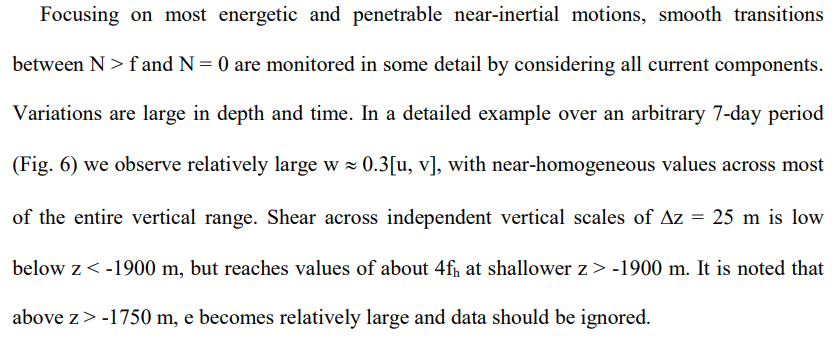
The phase speed of a parameter is inversely proportional to its amplitude slope in the vertical-time plane. Considering w(f), several changes in [z, t]-slope are observed, e.g. at day 181 near z = -1750 and near -2000 m, at day 185 near -2025 m (circles in Fig. 6). These changes are all abrupt in z, from one independent vertical position to the other (about 25 m apart). The slant-sloping amplitudes are less by a factor of 1.0-1.5 than the vertically uniform w(f). Such changes may point at a transition of super-inertial motions from stratified to homogeneous and homogeneous to (stronger) stratified layers, respectively. This is qualitatively verified with results from a simulation in Section 4.
This paper is available on arxiv under CC 4.0 license.