Authors:
(1) Busra Tabak [0000 −0001 −7460 −3689], Bogazici University, Turkey {[email protected]};
(2) Fatma Basak Aydemir [0000 −0003 −3833 −3997], Bogazici University, Turkey {[email protected]}.
Table of Links
- Abstract and Introduction
- Background
- Approach
- Experiments and Results
- Discussion and Qualitative Analysis
- Related Work
- Conclusions and Future Work, and References
4 Experiments and Results
This section presents the findings and outcomes of the conducted experiments, providing a comprehensive analysis of the collected data. We critically assess the performance and effectiveness of the proposed methodology by employing various evaluation metrics and techniques. We compare the extracted features from different perspectives, evaluating their individual contributions to the classification task. Lastly, we present a thorough statistical examination of the obtained results, employing appropriate statistical tests and measures to validate the significance and reliability of the findings.
4.1 Evaluation
Table 5 presents the experiment results for the issue assignment. The models are evaluated on Team Assignment (TA) and Developer Assignment (DA). The stacking model (RF and Linear SVC) achieved the highest accuracy, with values of 0.92 for TA and 0.89 for DA. Other models, such as Support Vector Machine, Logistic Regression, and Random Forest, also showed good performance with accuracies ranging from 0.86 to 0.88. The transformer-based models, including DistilBert, Roberta, and Electra, demonstrated competitive accuracies, with Roberta and Electra achieving the highest scores in some cases.
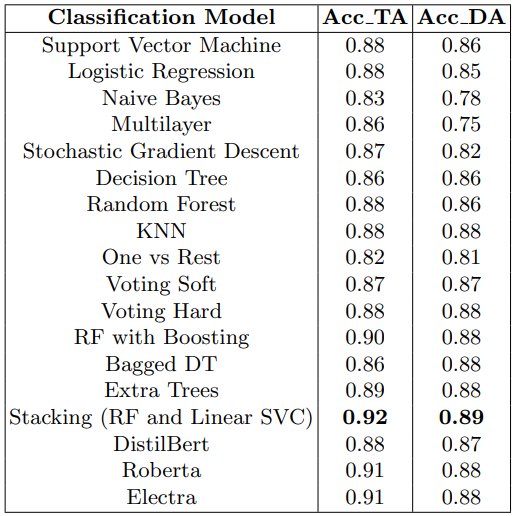
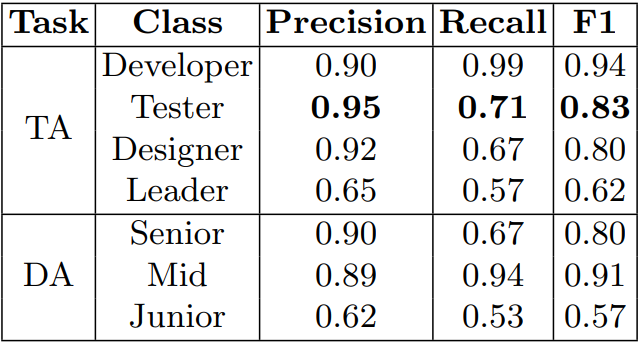
Table 6 provides the performance metrics for each class in the Stacking algorithm for issue assignment. Under the Team Assignment (TA) approach, the Stacking algorithm achieved a high precision value of 0.90 for the Developer class, indicating a low rate of false positive assignments. The Recall score of 0.99 for the Developer class demonstrates the algorithm’s ability to correctly identify the majority of instances assigned to developers. The Tester class shows a balance between precision (0.95) and recall (0.71), indicating accurate assignments with a relatively high rate of false negatives. The Designer class exhibits similar trends with a precision of 0.92 and a recall of 0.67. The Leader class has relatively lower precision and recall scores, indicating more challenging assignments for the algorithm.
Under the Developer Assignment (DA) approach, the Stacking algorithm achieved high precision values for the Senior class (0.90) and the Mid class (0.89), indicating accurate assignments with low rates of false positives. The Mid class also demonstrates a high recall score of 0.94, indicating effective identification of instances assigned to this class. The Junior class shows a lower precision (0.62) and recall (0.53) compared to the other classes, suggesting potential challenges in accurately assigning instances to this class.
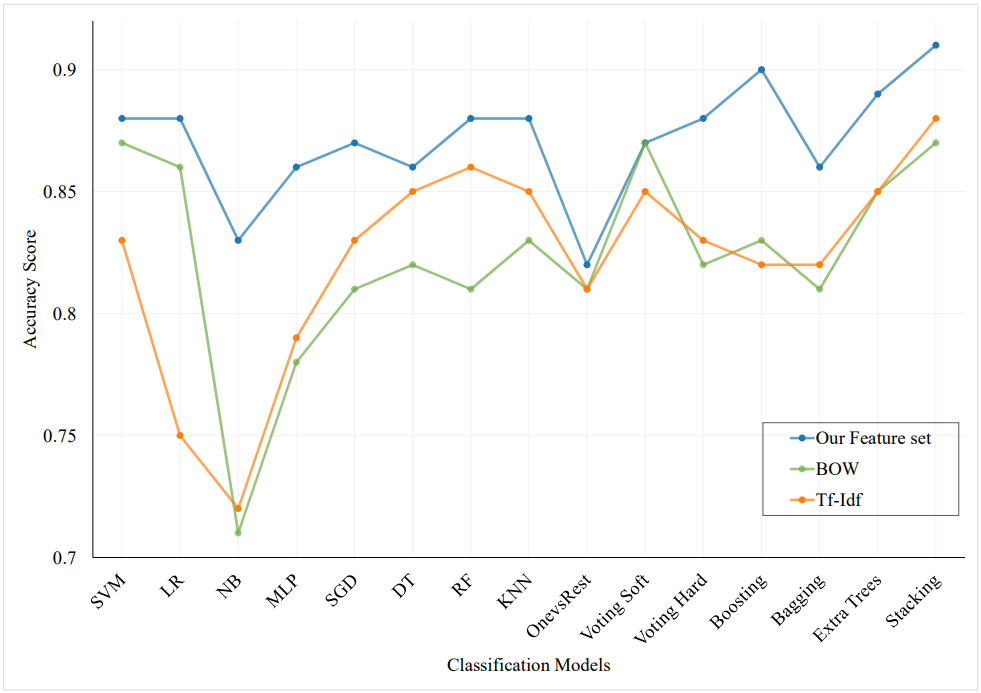
We also test our classification algorithms using the most popular word embedding techniques to determine how well our features work. Figure 5 illustrates the comparison of our feature set with Tf-Idf and BOW methods for the issue assignment. Despite the potential of Word2Vec as a word embedding algorithm, the accuracy results in my approach do not yield comparable outcomes. We use the accuracy score as the comparison metric. The graph demonstrates that using our feature set yields superior results while using Tf-Idf and BOW yields comparable results.
4.2 Feature Comparison
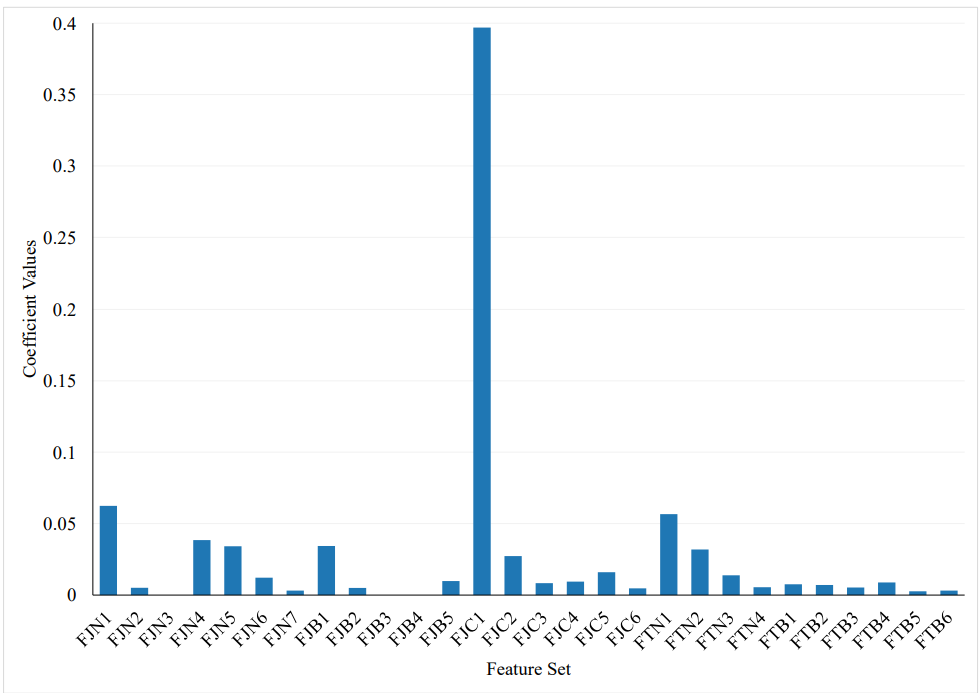
Reducing the number of redundant and irrelevant features is an effective way to improve the running time and generalization capability of a learning algorithm [12]. Feature selection methods are used to choose a subset of relevant features that contribute to the intended concept. These methods can employ a variety of models and techniques to calculate feature importance scores. One simple approach [9] is to calculate the coefficient statistics between each feature and the target variable. This method can help to identify the most important features of a given problem and discard the redundant or irrelevant ones. By reducing the number of features used for training a model, the running time of the algorithm can be significantly reduced without sacrificing accuracy. Moreover, feature selection can also improve the interpretability of the model, as it helps to identify the key factors that influence the target variable. We present the coefficient values of each feature in Figure 6.
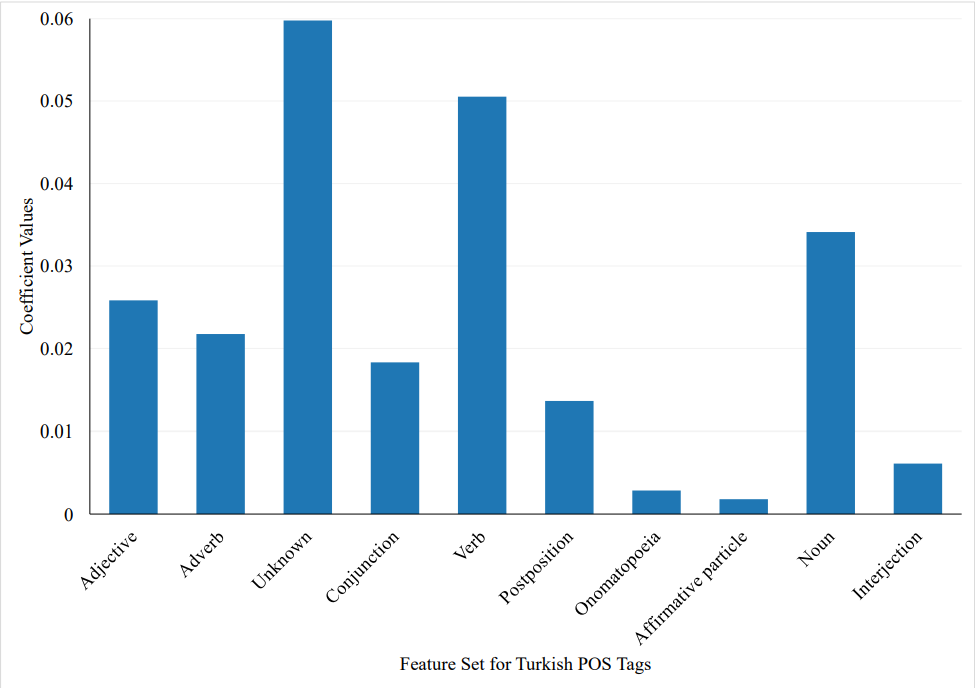
We find that Issue Type, namely FJC1, emerges as the most influential feature from our feature set. Apart from the Issue Type, we discover that the features Watchers and Summary Words also exhibit significant effectiveness in our analysis. Conversely, features such as Reopen Count, Test Execution Type, and Approval Type demonstrate no impact on our issue assignment process. In Figure 7, we present the effective POS tags in Turkish, highlighting the most influential ones among all POS tags. Notably, the number of unknown words, verbs, and nouns emerge as the most impactful features. Following the rigorous selection of the best features, we proceed to employ Scikit-learn’s [38] SelectFromModel, a powerful meta-transformer designed to choose features based on their importance weights, to retrain our models. Through this process, we carefully identify and select the top eight features that exhibited the highest significance, as determined by the module. Remarkably, leveraging this refined feature subset allows us to achieve optimal performance and attain the most favorable outcome in our experiments.
4.3 Statistical Analysis
Statistical significance tests are conducted to compare classification methods for determining whether one learning algorithm outperforms another on a particular learning task. Dietterich [14] reviews five approximate statistical tests and concludes that McNemar’s test and the 5x2 cv t-test, both have low type I error and sufficient power. In our study, we combine all data sets into a single data set for the classification algorithm. Dietterich [14] recommends using a 5x2 ttest to statistically compare two classifiers on a single data set. The 5x2 f-test, which is also suggested as the new standard by the original authors above, is further expanded upon by Alpaydın [4]. The following lists the null hypothesis and the alternative hypothesis. The null hypothesis is that the probabilities are the same, or in simpler terms, neither of the two models outperforms the other. The alternative hypothesis, therefore, holds that the performances of the two models are not equivalent.
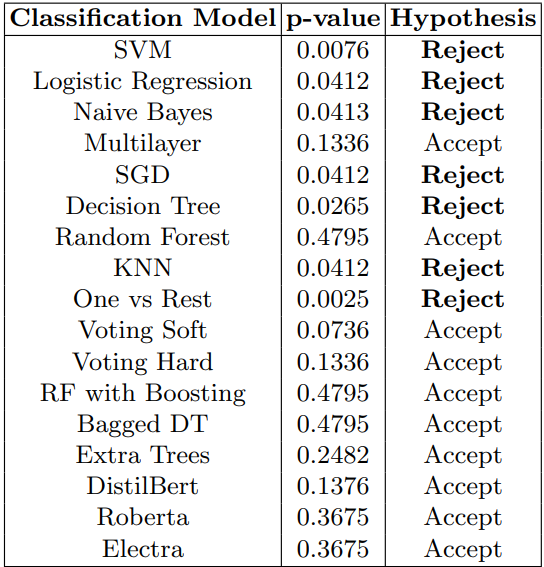
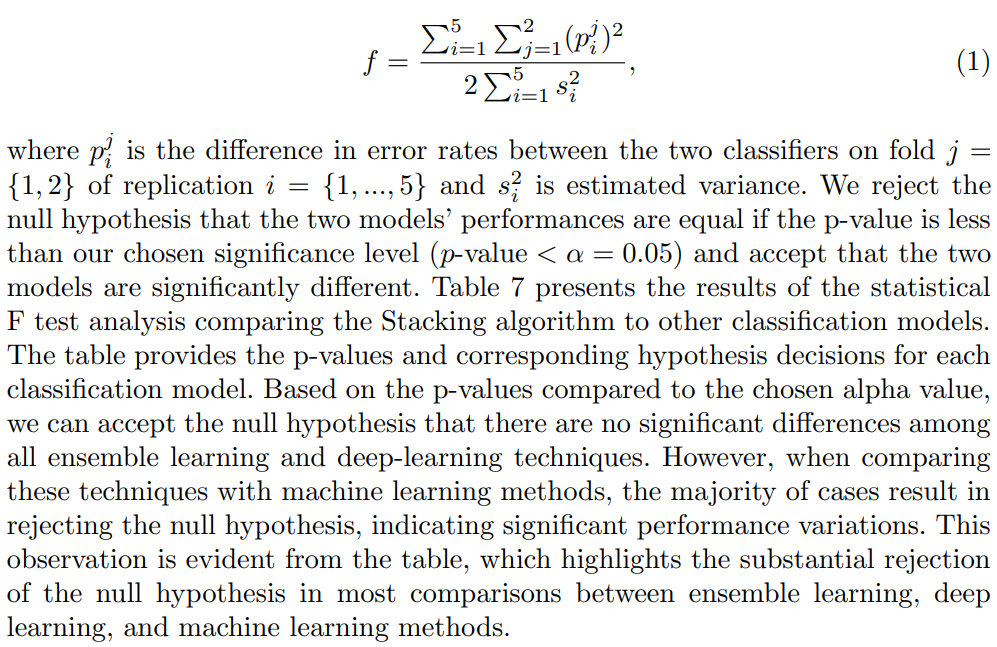
Accordingly, we apply the 5x2 f-test implemented by Alpaydın [4] which is an extension of the 5x2 cv t-test as stated above. We create the matrix for all pairwise comparisons of learning algorithms. In this test, the splitting process (50% training and 50% test data) is repeated five times. A and B are fitted to the training split and their performance on the test split in each of the five iterations is assessed. The training and test sets are then rotated (the training set becomes the test set, and vice versa), and the performance is computed again, yielding two performance difference measures. Then, the mean and variance of the differences are estimated and the f-statistic proposed by Alpaydın is calculated as
This paper is available on arxiv under CC BY-NC-ND 4.0 DEED license.

