Authors:
(1) Pietro Saggese, Complexity Science Hub Vienna (CSH);
(2) Esther Segalla, Oesterreichische Nationalbank (OeNB);
(3) Michael Sigmund, Oesterreichische Nationalbank (OeNB);
(4) Burkhard Raunig, Oesterreichische Nationalbank (OeNB);
(5) Felix Zangerl, Austrian Financial Market Authority (FMA);
(6) Bernhard Haslhofer, Complexity Science Hub Vienna (CSH).
Table of Links
- Background and related literature
- VASPs: A Closer Examination
- Measuring VASPs Cryptoasset Holdings
- Closing The Data Gap
- Conclusions, Declaration of Competing Interest, and References
Appendix A. Supplemental material
4. Measuring VASPs Cryptoasset Holdings
After describing the VASPs service offerings, we now move on and devise an approach to empirically assess their solvency by correlating data from multiple on-chain and off-chain sources. The underlying intuition is that, by quantifying the cryptoassets held on-chain by one VASP, we should be able to verify the numbers reported in the balance sheets. Furthermore, it is sufficient to measure the asset side, because on the liability side cryptoassets are either customer liabilities or equity. Since balance sheet assets minus liabilities are equal to equity, our approach serves as a first proof of solvency.
We first discuss which DLTs we analyze, motivate our choice, and document our approach to reconstruct the VASPs net positions by extracting the data from the two most relevant DLTs, Bitcoin and Ethereum. VASPs wallet addresses are extracted from a large collection of public attribution tags, or identified by executing manual transactions, and have not been revealed by the VASPs themselves. Next, we describe the balance sheet data from the commercial register. We concentrate our empirical analysis on four VASPs whose wallets appear in the attribution tag collection and that have published their balance sheets consistently over time, allowing to compare on-chain cryptoasset holdings to balance sheets. Their market share is around 99% of the total market share.
4.1. On-chain data
DLTs can be divided into two major typologies based on their conceptual design. They either follow the Bitcoin-like Unspent Transaction Output (UTXO) or the Ethereum-like account model. Both support by design a native token, like bitcoin or ether. The latter, by enabling the deployment of arbitrary smart contracts, also supports issuing non-native tokens such as the stablecoins USDT, USDC, and DAI.
We begin by gathering the transaction history of the two most relevant DLTs, Bitcoin and Ethereum, from their origin to the 3rd of April 2022[8]. We focus on the Bitcoin and Ethereum ledgers for the following reasons: first, as shown in Section 3, all VASPs operate with bitcoins and in most cases also with ether. Cryptoassets deployed on other DLTs are less relevant. Second, bitcoin, ether, and the stablecoins USDT and USDC alone account for more than 70% of the total cryptoasset market capitalization, and these are also the most traded and held cryptoassets by CEXs customers[9]. Third, while stablecoins like USDT are deployed on multiple smart contract-compatible ledgers[10] and currently deploy significant amounts of tokens also in other DLTs[11], Ethereum is historically the most relevant one.
We implement two approaches to extract on-chain VASP-related information for the UTXObased and the account-based DLTs. The entities that operate on the Bitcoin blockchain interact with each other as a set of pseudo-anonymous addresses. We exploit known address clustering heuristics (Androulaki et al., 2013; Ron & Shamir, 2013; Meiklejohn et al., 2016) to associate addresses controlled by the same entity[12]. Furthermore, we exploit a collection of public tagpacks, i.e., attribution tags that associate addresses with real-world actors, to filter the clusters associated with any of the VASPs considered in our study. We expanded the dataset by conducting manual transactions with the VASPs in our sample (further details are discussed in Appendix A, where we also report a list of the addresses used). We identified 88 addresses and their corresponding clusters associated with four different VASPs.
To reconstruct their net positions, we filter the Bitcoin transaction history and select only the transactions in which the sender or recipient is an address associated with the four VASPs. In total, we consider 1,574,125 Bitcoin transactions.
We use a different approach for the Ethereum DLT. An Ethereum address identifies an account whose state is updated via state transitions through transactions. The account state stores information about the balance and the number of transactions executed, maintaining thus a historical database. While approaches for address clustering have been devised for Ethereum as well (Victor, 2020), in practice, addresses are typically reused. We thus extract all relevant information by running a full Erigon Ethereum archive node (Ledgerwatch, 2022). Similarly to the previous approach, we exploit attribution tags and manual transactions to identify the addresses associated with VASPs. In total, we identified nine relevant addresses associated with three different VASPs. We proceed by querying the state of each account, from the beginning of the Ethereum transaction history (block 0) to the 3rd of April 2022, every 10,000 blocks. In addition to the ether balance, we collect data on the address balance for the tokens USDT, USDC, DAI, wETH, wBTC. The list of ground-truth addresses is reported in the appendix.
We remark that our attribution dataset contains more than 265,000,000 deanonymized Bitcoin addresses, covering more than 24% of the total number of existing Bitcoin addresses. In addition, 278,244 tagged Ethereum addresses cover 0.11% of the existing addresses. The former identifies around 3000 entities active in the Bitcoin ecosystem, the latter more than 25,000 Ethereum entities.
4.2. Off-chain data
We collect balance-sheet data for 17 Austrian VASPs through the Austrian Commercial Register. We construct an unbalanced panel data[13] starting from 2014 to 2021. Ultimately, in our empirical analysis, we use the data of four Austrian VASPs for which we can identify on-chain and off-chain data. Our variable of interest is a firm-level measure of crypto asset
holdings. Some firms describe their crypto asset holdings as explicit balance-sheet items; for other firms that aggregate them with other items we construct a variable that approximates the corresponding crypto asset holdings from their described asset items. The balance sheet does not allow us to distinguish between cryptoasset holdings such as ether and bitcoin. The variable crypto asset holdings in form of red markers in Figure 6, Figure 7, Figure 8 and Figure 9 represents those balance-sheet items.
4.3. Comparing on- and off-chain data
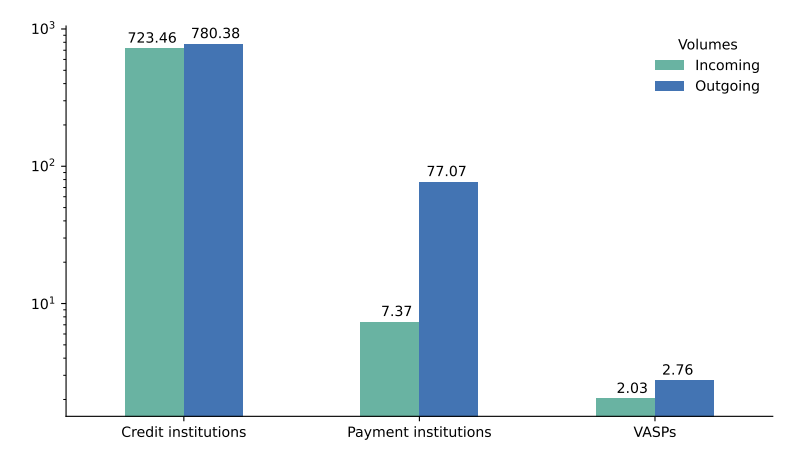
Supervisory data from FMA show that in a 12-month period (roughly 2021 until 2022 due to varying reporting dates for VASPs), the transaction volume of virtual assets converted to EUR conducted by VASPs registered in Austria amounts to 2.03 billion incoming transaction volume and 2.76 billion outgoing. The transaction volume is computed as the sum of the transactions related to customer relationships only. As Figure 5 shows, in comparison, during the same time we observed a transaction volume for credit institutions of 723.46 (incoming) and 780.38 (outgoing) billion and of 7.37 (incoming) and 77.07 (outgoing) billion for payment institutions.
Table 2 reports additional supervisory data from FMA on the number of VASP customers by residence and legal form. A VASP customer refers to a natural or legal person, who has opened an account and gone through a validated KYC process with the particular VASP. The rows distinguish natural persons, i.e., individuals, and legal persons, i.e., entities with legal rights. Customers are further divided by jurisdiction: the first column indicates the number of Austrian customers, while the second one reports the number of customers in the European Union, excluding Austrians (we note that customers are never counted in two columns). The subsequent columns identify customers by jurisdictions that are respectively offshore financial centers (IMF, 2019), subject to embargo (WKO, 2020), and under increased monitoring (grey list; FATF, 2022). The last columns respectively aggregate all remaining countries and report the total number of users. The assignment works in such a way that countries that appear in several lists will be assigned to the group that bears the greater risk. Total customers are 1.79 million, and they are mainly natural persons. The vast majority are Austrian or members of the European Union (respectively around 327,000 and N = 1,279,300). We note that this number might include customers who created an account but never transacted, i.e. the count is not weighted by transaction number. Furthermore, the same customers can have accounts at multiple VASPs. Customers from subsidiaries and inactive are excluded.

The four entities we study cover around 99% of the Austrian VASP transaction volumes measured in total assets. Consistently with the labels introduced in Figure 4, we denote them as VASP-2, VASP-5, VASP-9, and VASP-12 and hide their real names to avoid that the corresponding VASPs can be directly recognized in our study. They are representative of different VASP groups (i.e., money exchanges, brokers, and brokers with trading platforms).
4.3.1. VASP-2
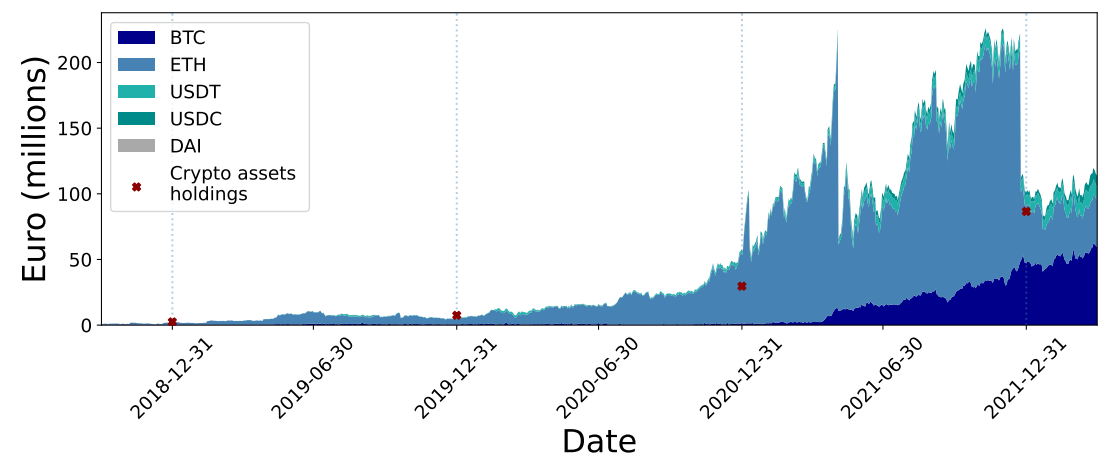
Observations. We report the values for VASP-2 in Figure 6. In this and the subsequent plots, the bitcoin holdings are in dark blue, ether in light blue, USDC in dark green, USDT in light green, and DAI in gray. The dots represent the cryptoasset holdings declared in the balance sheet data at the end of each year for the period 2018 to 2021. This VASP implements a trading platform and falls within group 3.
The cryptoasset holdings identified on-chain correspond to 75.59% of the cryptoassets declared in the balance sheet at the end of 2018, 66.68% at the end of 2019, 194.56% at the end of 2020, 116.79% at the end of 2021. The amount of bitcoin increased significantly after April 2021, and the largest amount of tokens is held in ether.
Findings. Overall, the two sources of information point in the same direction. Interestingly, after 2020, the on-chain activity is higher than what the balance sheet reports. A possible interpretation is that the cryptoassets in excess represent equity or private funds. VASP-2 reports well-separated balance sheet positions, allowing us to compute precisely the amount of cryptoasset holdings.
4.3.2. VASP-12
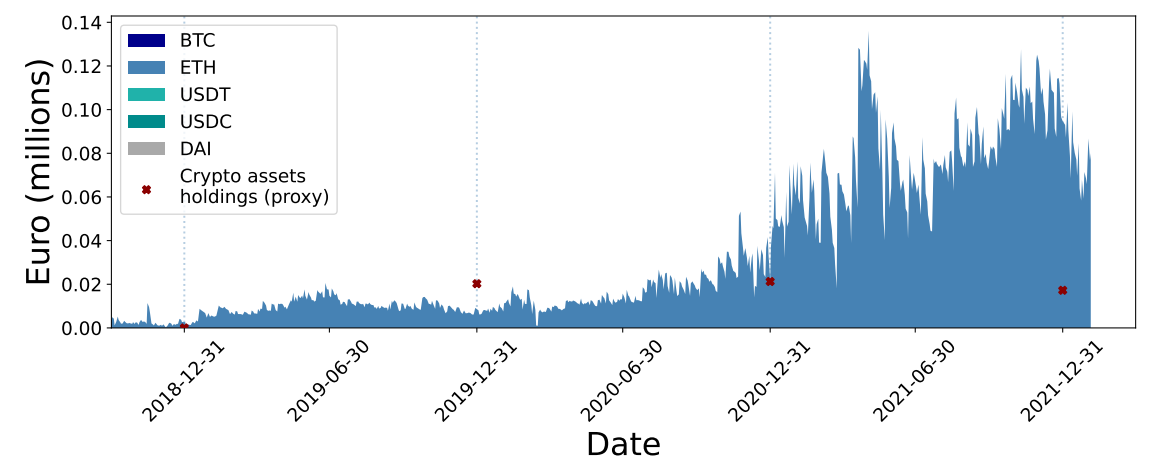
Observations. Figure 7 shows the cryptoasset holdings of VASP-12. It is a non-custodial VASP that provides exchange services based both on ether and bitcoin. The cryptoassets measured on-chain are partially comparable with those reported on the balance sheets (42.59% at the end of 2019, 102.45% at the end of 2020, but 549.38% at the end of 2021).
Findings. Similarly to VASP-2, on-chain activity is higher than the value reported on the balance sheet after 2020. As expected, the amount of cryptoasset holdings is small, as the VASP is non-custodial, and exceeds 100K EUR only after 2021. All reported assets are ether: the absence of stablecoins is expected, as this VASP trades bitcoin, ether, and a few other cryptoassets. However, we could not identify bitcoin flows from or to their wallets in the time frame we considered. To identify the addresses associated with this VASP, we relied on manual transactions: re-identification attacks are a possible strategy to collect attribution tags. While this strategy is effective for Ethereum accounts, the Bitcoin addresses we gathered identify the VASP activity dating back to November 2022 only, thus outside of the time frame we considered.
Regarding balance sheet data, we note that the values, in this case, are a proxy: cryptoassets are aggregated with other items in the balance sheet.
4.3.3. VASP-9
Observations. VASP-9 is shown in Figure 8. It is categorized in group 5 in Subsection 3.1. Unlike the previous cases, the cryptoasset holdings cover only a tiny fraction of the funds declared in the balance sheets; in the best case, i.e., at the end of 2021, we can identify on-chain only 16.85% of the total cryptoassets reported in the balance sheet.
Findings. A possible explanation for the discrepancy is that our dataset might include only hot wallets, i.e., addresses used to conduct daily operations such as the deposit and withdrawal, but not the cold wallets, i.e., addresses that control the large majority of customers funds and that are subject to stricter security measures. An alternative explanation could be that the considered VASP is part of a larger company structure and that the company engages next to VASP activities also in non-VASP-related business activities. In that case, the reported balance
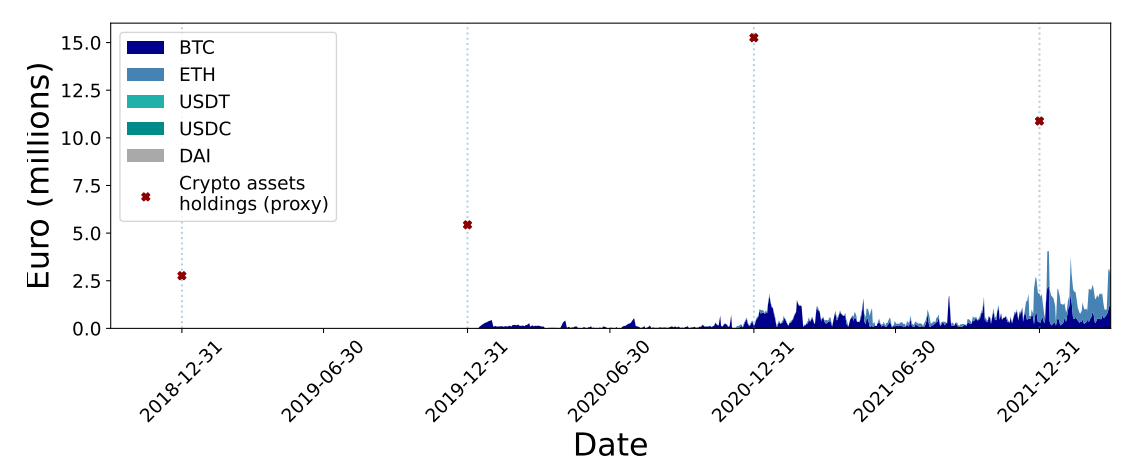
sheet items might contain aggregated business activities, whereby it is difficult to disentangle the specific positions related to the crypto activities of the VASP-9. As a result, the proxy variable from the balance sheet might then overestimate the actual figure we are interested in.
Furthermore, this VASP operates with multiple DLTs and also exchanges stablecoins, but the cryptoasset wallets we analyzed do not hold any USDC, USDT, or DAI.
4.3.4. VASP-5
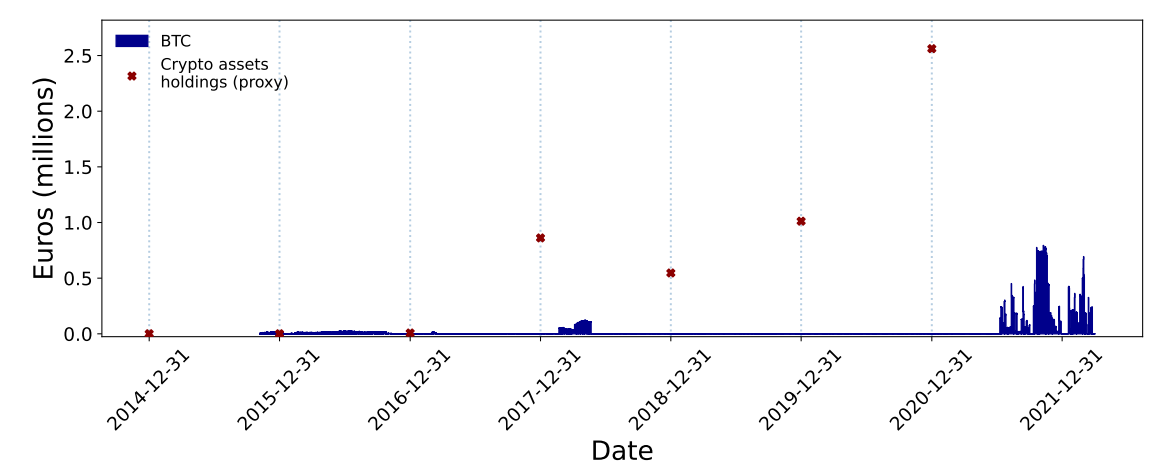
Observations. VASP-5 is the last we analyze; values are shown in Figure 9. This VASP bases its services on the purchase and sale of bitcoins. For this VASP, using both attribution tags in the TagPack database mentioned above and re-identification strategies, we could only gather information for a few months in between 2014 and 2017 and after 2021. The results are consistent only for the years 2015 and 2016, when the VASP held very small amounts of cryptoassets, if compared to the subsequent years.
Findings. Similarly to VASP-9, we could not collect sufficient data to obtain comparable values to the figures reported in the balance sheets. As for VASP-12, the Bitcoin addresses we gathered through manual transactions identify clusters whose transaction history only dates back to a few months (mid-2021). Again, this highlights that re-identification is less effective for Bitcoin than Ethereum addresses.
The data gap between 2018 and 2020 reveals another issue: likely, after 2017, funds were moved to other addresses that are not reused with those in our sample. VASPs apply different strategies to organize their cryptoasset transfers and holdings, e.g., to create new addresses for each transaction, or reuse them. If they are not reused, cryptoasset holdings can be held at multiple apparently unrelated clusters that can change over time.
This paper is available on arxiv under CC BY 4.0 DEED license.
[8] The time frame can be extended to 2022 to include the balance sheet of upcoming years when available.
[9] See https://coinmarketcap.com/charts/ and https://coinmarketcap.com/rankings/exchanges/
[10] see, e.g., USDT https://bit.ly/3YSYNwR and USDC https://www.circle.com/en/multichain-usdc
[11] https://tether.to/en/transparency/.
[12] New addresses can be created in each transaction. However, if they are re-used across transactions, they can be linked and identified as belonging to the same entity.
[13] i.e., time observations are different for different VASPs.

